Copyright © 2017 CPGAnalytics101
1. Distribution – We factor using %ACV. Did the brand gain or lose distribution and what does that translate into in terms of dollar gains or loss?
Calculation: (Current %AVC – Year ago %ACV) x (Year ago Base $ / Year ago %ACV)
2. Base Velocity – We factor $ per point of %ACV Distribution. Did the brand see an increase or a decrease generated on a per point of ACV?
Calculation: (((Current Base $ / Current %ACV) – (Year ago Base $ / Year ago %ACV)) x (Current %ACV))
3. Incremental sales – We factor total incremental dollars. Did the brand generate more or less incremental dollars through casual trade support? We could break this out further by bucketing it into Feature Only, Display Only, Feature & Display combination, and Temporary Price Reductions (TPRs). But for our exercise we will not do this and keep it simple by looking at just total incremental dollars.
Calculation: Current incremental $ - Year ago incremental $
4. New items – Did the brand innovate by introducing new variants e.g. new sizes, flavors and quality to the category? We will factor how much in terms of dollars it contributed to the brand.
Calculation: Items with $ in current year that did not exist year ago
5. Delisted items (DCd) – Did the brand discontinue selling certain items in the portfolio? Maybe the Flakes brand delisted a 64oz item and swapped out for a 72oz item instead? There are always a sales transition between new and delisted items if the new item is intended to replace the old delisted item. If speed to shelf is not executed properly, there will be lost dollars in the transition, and is why we factor this as a sales driver. Did sales of new items offset losses of delisted items?
Calculation: Items either with $0 in current year that had sales year ago, and or set a trend benchmark where delisted items trending down more than (-70%) are termed delisted.
Result:
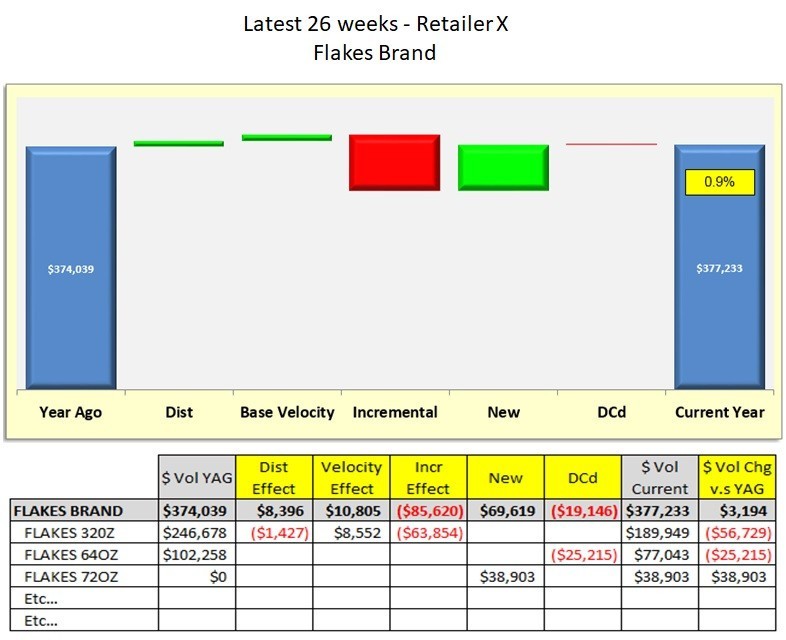
The Flakes brand is slightly trending up in dollars by +0.9% vs. year ago which is driven mostly by new item gains with slight upticks in distribution and velocity which offset incremental losses. It is recommended to review detailed casual performance by frequency, %ACV support, promoted pricing, seasonality, and competitive activities in order to improve incremental sales moving forward.
Some other factors might include:
- Retailer X position on our brand? Did they purposely promote us less over another preferred brand, or part of a new strategy to bolster their NBE or Private Label business?
- Did our company shift focus away from the Flakes brand, and switched trade funds to another brand or business unit?
- Did we have out of stock conditions during peak promotional events that equaled lost sales in the past year? Or was there a recent shelf reset where the Flakes brand received less facings or is now in less stores? Internally - Check shipment data & Externally - Check Retailer X schematic?
Basic Sales Decomposition Analysis
There are always several ways to drill down and uncover sales drivers for a product or category. The example breaks out the Flakes brand into sales buckets driving its business up or down. We will use 26 week data. Using 26 weeks is a good spot since periods of 13 weeks or less can be more influenced by trade factors. Annualized of 52 week data can also be used, but a 26 week picture can give a more recent snapshot for my needs and is a preference. The resulting data is put into a waterfall chart. You can read more about Waterfall charts on our blog.
We start with dollar sales year ago as our starting point, and end it with the latest dollar sales as our ending point. The bars in-between are the sales drivers (gain or loss) that helps us to from our starting point to our end point. The five main drivers we will factor for are: Distribution, Base Velocity, Incremental sales, New items, Delisted items. We will show how each driver is calculated using POS data.