Copyright © 2017 CPGAnalytics101
Product Hierarchy
When working in analytics, there is typically a product hierarchy structure created in the database. Everything has an organization to it, and when viewing the database you will see the structure start at a high level which is usually the category then down to a granular which is the item/UPC level. The bottom level is the base that makes up the upper portions of the hierarchy structure.
However, things do evolve. With the introduction of Liquid data, the hierarchy structure can be customized where the top level may be pack type, or flavor as an example. But our example lays out the most typical structure, especially for those whom use a syndicated database vs. a custom database where the client can dictate how to structure their hierarchy. The example chart below is the typical product structure.
The chart above starts with the category being the highest level in the structure, though there are higher levels such as super category, department, aisle, etc.....but we want to focus at the category level first and drill down. The category might be made up of sub-categories or segments (Category Rice, Plain Rice segment, Flavored Rice segment). We then go into the vendor level which can be made up of several brands then down the sub-brands (Bob's Plain Rice, Bob's Flavored Rice). After that we may drill down into the size level for each brand or sub-brand (1lb or 5lbs). Then at is't lowest level, we will look into item or UPC level (Bob's Plain Rice 1lb 1234567890). In this structure, the size level could be substituted but that depends on which category you are looking it.
With this structure in mind, third party data suppliers might piece this together in a similar way and call it a category or product hierarchy in their database for users to extract. This may by also be structured by how a consumer may shop or behaviors towards the category in the aisle when choosing a product. However, extra layers are likely added such as, pack sizes, flavors, specialty, quality, pack type, etc. This is also known as a consumer decision tree which is briefly covered below.
Consumer Decision Tree
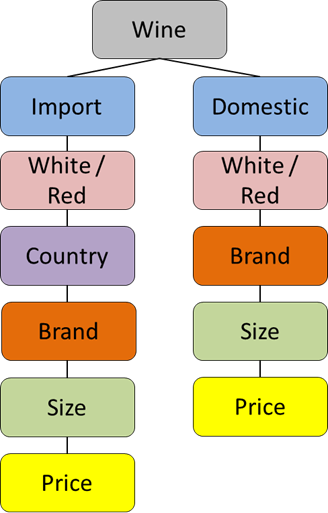
In this example decision tree, the category is Wine. This is based on the attitudes and perceptions on how a consumer shops a category which can be obtained through external studies, surveys, etc. A consumer might first decide if they want a domestic or imported Wine. If they seek an imported wine, they may decide if they want a red, white and from which country. After that, they may decide on the brand followed by size, and factor how much they are willing to spend on that wine product. Each category is unique and have several layers or attributes that may dictate how a consumer shops a category. In our example, deciding on the brand is lower in the decision tree for Imported Wine when compared to consumers buying Domestic Wine. Sometimes pricing may be the primary factor, or a flavor type, or the quality.
Private Label or NBE (National Brand Equivalent) can play a major role in a category or may dominate it as the brand leader and thus may change the purchase decision of the consumer. Private Label will usually drive a high profit margin for the retailer. So if you were to look at "Opportunity items" to consider deleting in your Sku rationalization analysis, NEVER include Private Label items in that analysis, unless the retailer requests it.
Sales Analytic Tree
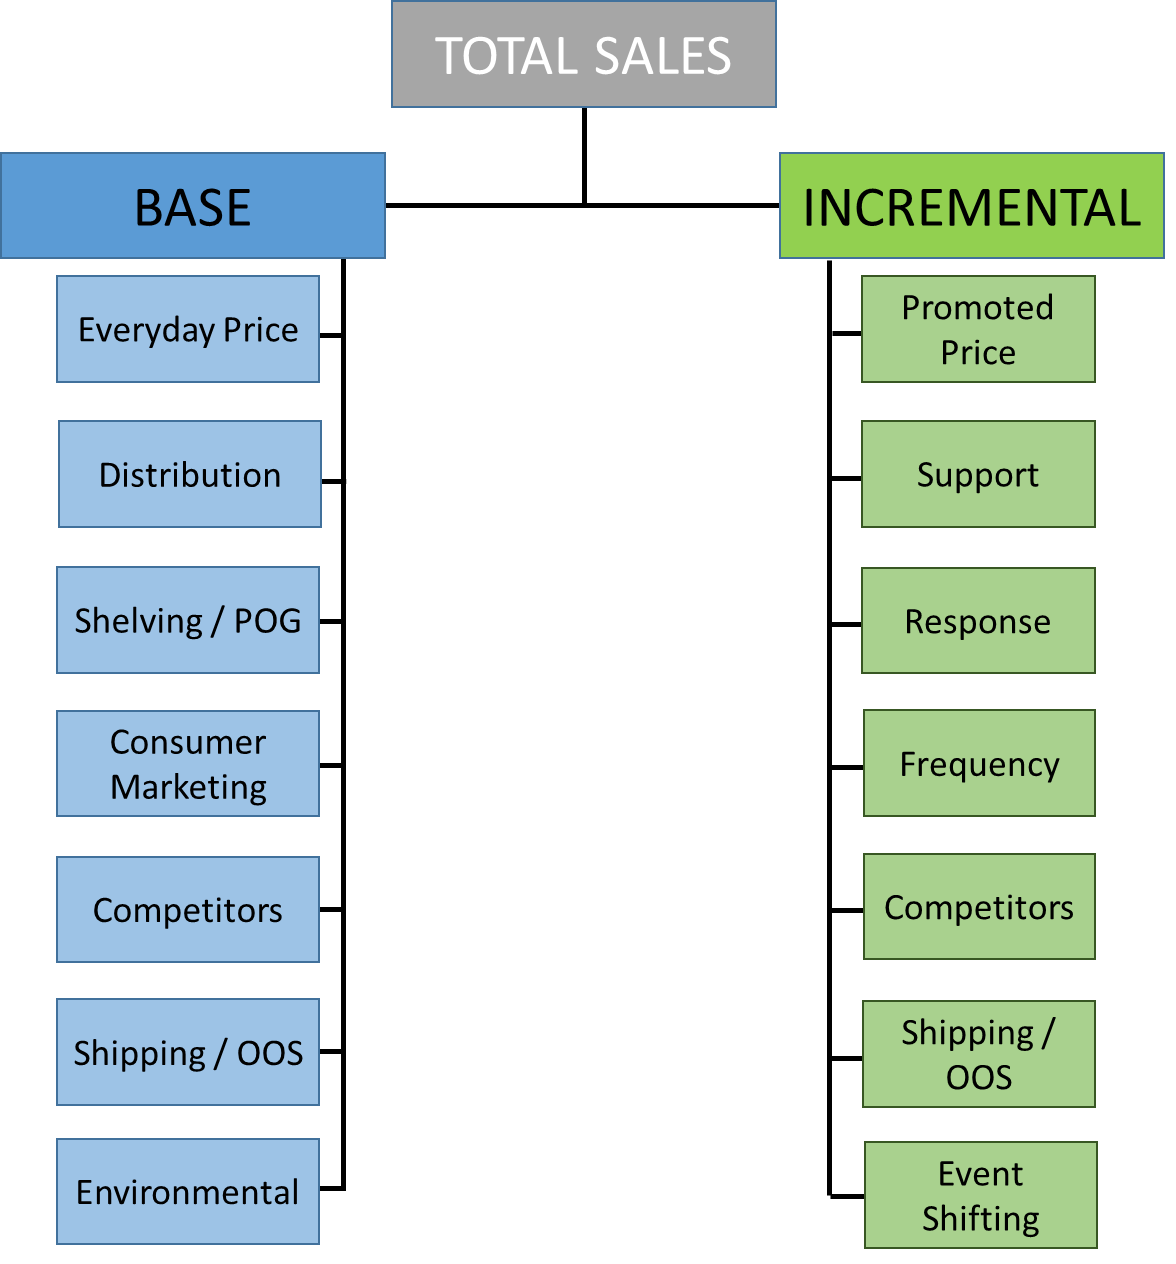
The Sales Analytic Tree is a basic framework used to quickly breakdown a category or products performance in a given market and period. In our example we are breaking out total Dollars (Units & Volume can be used) between Base and Incremental. Each component has sub-sets of data that are needed to fill in the sales drivers for Base & Incremental.
Base drivers we look at are:
ACV Distribution, Base Price, Shelving (if facings changed-input from retailer), Competitive activity (aggressive promotions and price gaps), out of stocks (internal shipments), Consumer Marketing (campaigns e.g. Coupons, digital – not in POS) as well as factoring environmental issues.
Incremental drivers we look at are:
Promoted Price (typically 5% discounted off everyday / base price) which includes display, features, a combination of the two, and TPR prices. Other factors include chain or store promotional support (all stores support the promotion or supported in zones), promoted frequency (more or less weeks promoted), response (how promotion resonated with consumers & determine the % Lift above baseline by casual), out of stock issues (internal shipments), and competition (trade aggressive, price gaps, timing of promotion). Also check if the timing of promotion shifted vs. yag? Environmental can also play a role too due to coincidence of timing and could impact out of stock conditions regardless if the product is on deal or not.
Other things to consider but not factored in the tree are changes in commodity prices, Govt. regulations, international & domestic economic conditions (impacting necessity vs. luxury), changes in consumer demand (e.g. generational perceptions & characteristic’s), and perhaps world events e.g. boycotts.
Base = Everyday
Long term business
Questions to consider?
Incremental = Promoted
Short term business
Questions to consider?

Has base price changed? Competitive price? Price gap?

How Point of Sales (POS) is typically collected
POS data is collected from store scanners. Every time an item is scanned at the register for purchase, the store collects information such as:
- Store # and Location
- Product description
- Price
- Quantity
Auditors visit all sample stores every week to report causal/merchandising activity. (Displays, Features, T.P.R.s).
Data from retailers and merchandising activity from auditors is delivered to data suppliers on a weekly basis. There is Census & Sample data which means Census data collects data among all stores while Sample or projected data is collected from a representative set of stores in a chain. The data set is then projected out to represent the chain as a whole.
Standard Data Dimensions needed
When a request to perform an analysis on something, it is VITAL the requester answer these data dimensions which are: Products, Time, Geography, and Facts / Measures.
The Four Data Dimensions used in POS are:
Time/Periods: Measurements of time that express when sales took place (i.e., weekly, monthly, annual, fiscal half, etc.)
Geography: Define a geographical location where a product is being sold (i.e., Total US Food, San Francisco, Albertsons, etc.)
Like products, there are many layers to view. This will be covered off in the Geography portion below.
Products: Define a consumer good (i.e., UPC, Brand, Segment, Category, an aggregation of products,etc.)
Facts / Measures: Define a type of measurement (i.e., $ sales, unit sales, distribution, velocity, promotions, etc.)

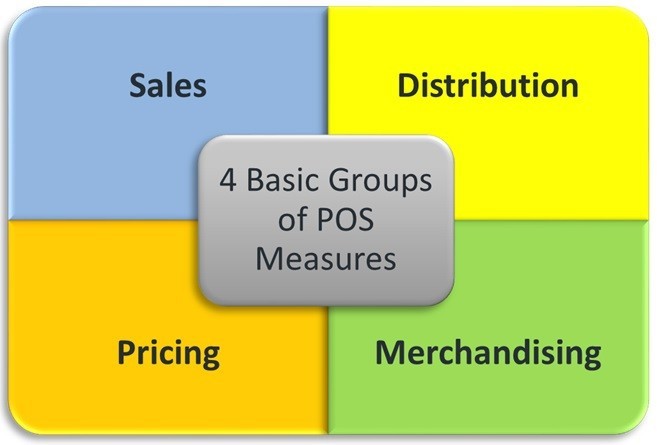
The Four Basic Groups of POS Measures
The Four Basic groups are a huge driving force behind in understanding the necessities of the business. There is a sub-tab for this subject on our website that goes into more details which include: definitions, calculations, and some examples on how it is applied. But for now, these four basic metrics will generally help you understand if your product gained of lost and what are some of the aspects that drive this?
Sales: Dollars, Units, Volume
Distribution: %ACV Wtd, TDP, Average & Max ACV
Pricing: Average Price, Base & Promoted Price, Price per serving, etc
Merchandising: Casual e.g., Features, TPR, Display combinations, promotional response/support and Wtd weeks
Has ACV Dist changed?
Less depth TDP & breadth ACV?
# items change (AIS)?
Schematic changed?
Less facings?
Has # campaigns or quality changed? Less effective execution?
Competitors promoting more? Better priced? New entrants?
Was store shorted cases? Was there Out of Stock (OOS) conditions?
Was there a "run-on" in buying product due to environmental or acts of nature?
Has promoted price changed? Competitive price? Price gap?
Has store support ACV promoted changed? Has supported shifted?
Did we get more/less %Lift from our promotion vs. YAG? Which casual promo was a driver?
Did we promote more / less weeks vs. YAG? Which promo was the driver of more/less frequency?
Did competitor promote aggressively? Support launch of new items?
Was store shorted cases? Was there Out of Stock (OOS) conditions during event(s)?
Did our promotional event periods change vs. YAG? Did seasonality expand/decrease causing timing of events to change?
Base Price
Any Promo Price or by casual.
%ACV, TDP, AIS
%ACV Any Promo or by casual
Not in POS In Schematic
% Lift Any Promo or by causal
Not in POS Ask Marketing
CWW Any Promo or by casual. CWW = Cum Wtd Wks, see 4 metrics
Pull data on direct competitors for base and incremental sales
Internal shipments, brief from customer, or monitor for %ACV drop during event(s)
%ACV drops, internal shipments, spike in
base during act of nature.
%ACV & % $ Any promo or by casual vs. YAG
Measures